
80+ Percent Dependent Purchasers
These are the six-digit contracting industries that are more than 80% dependent on DoD contracts.
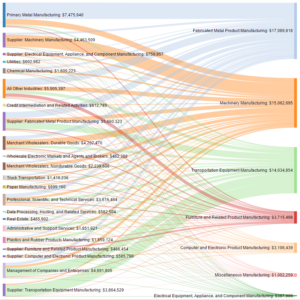
Durable Goods Manufacturing
The Durable Goods Manufacturing Supply Chain is quite varied, with no supplier having more than $7.5 million in defense-driven sales to contracting industries.
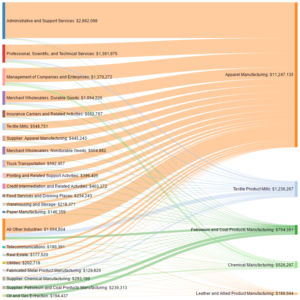
Non-Durable Goods Manufacturing
The Nondurable Goods Manufacturing Supply Chain includes three primary defense-related purchasing industries.
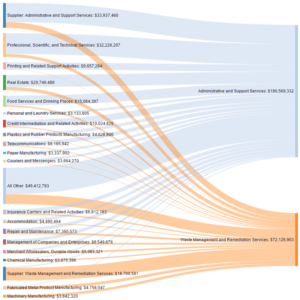
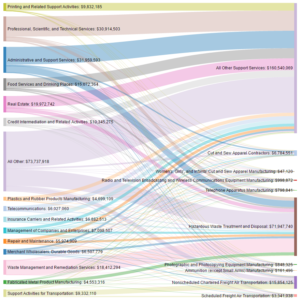
Administrative Support and Waste Management
The Administrative and Support Services and Waste Management and Remediation Services industry group demonstrates a highly dispersed supply chain.
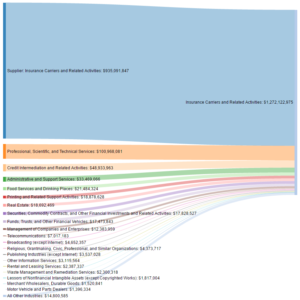
Finance Insurance and Management
The Finance, Insurance, and Management Supply Chain is dominated by one purchaser—Insurance Carriers and Related Activities—and 74% of defense-driven Finance, Insurance, and Management purchases are internal to that sector.
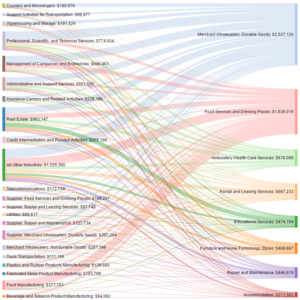
Other Services and Trade
The Other Services and Trade Supply Chain is one of the more dispersed supply chains in the defense sector; it is a collection of defense industries that do not fit well in another group.
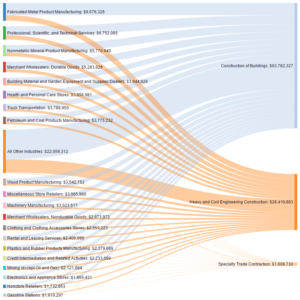
Construction and Extraction
For the Construction and Extraction Supply Chain, no industries supply more than $10 million to construction and extraction contractors.
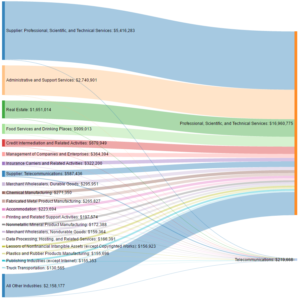
Information Professional and Scientific
Overall, Kentucky’s Information, Professional, and Scientific defense activity is largely related to Professional, Scientific, and Technical Services rather than Telecommunications.
![]()
Transportation Wareshousing and Utilities
The Transportation, Warehousing, and Utilities Supply Chain is another highly dispersed supply chain in the defense sector.